Challenges
PI Attributes
I found it quite challenging to produce a clean visualization of PI attributes. I workshopped the layout and styling with a colleague using a whiteboard and sticky notes. I wrote every attribute available on sticky note, and reorganized them into logical groupings.
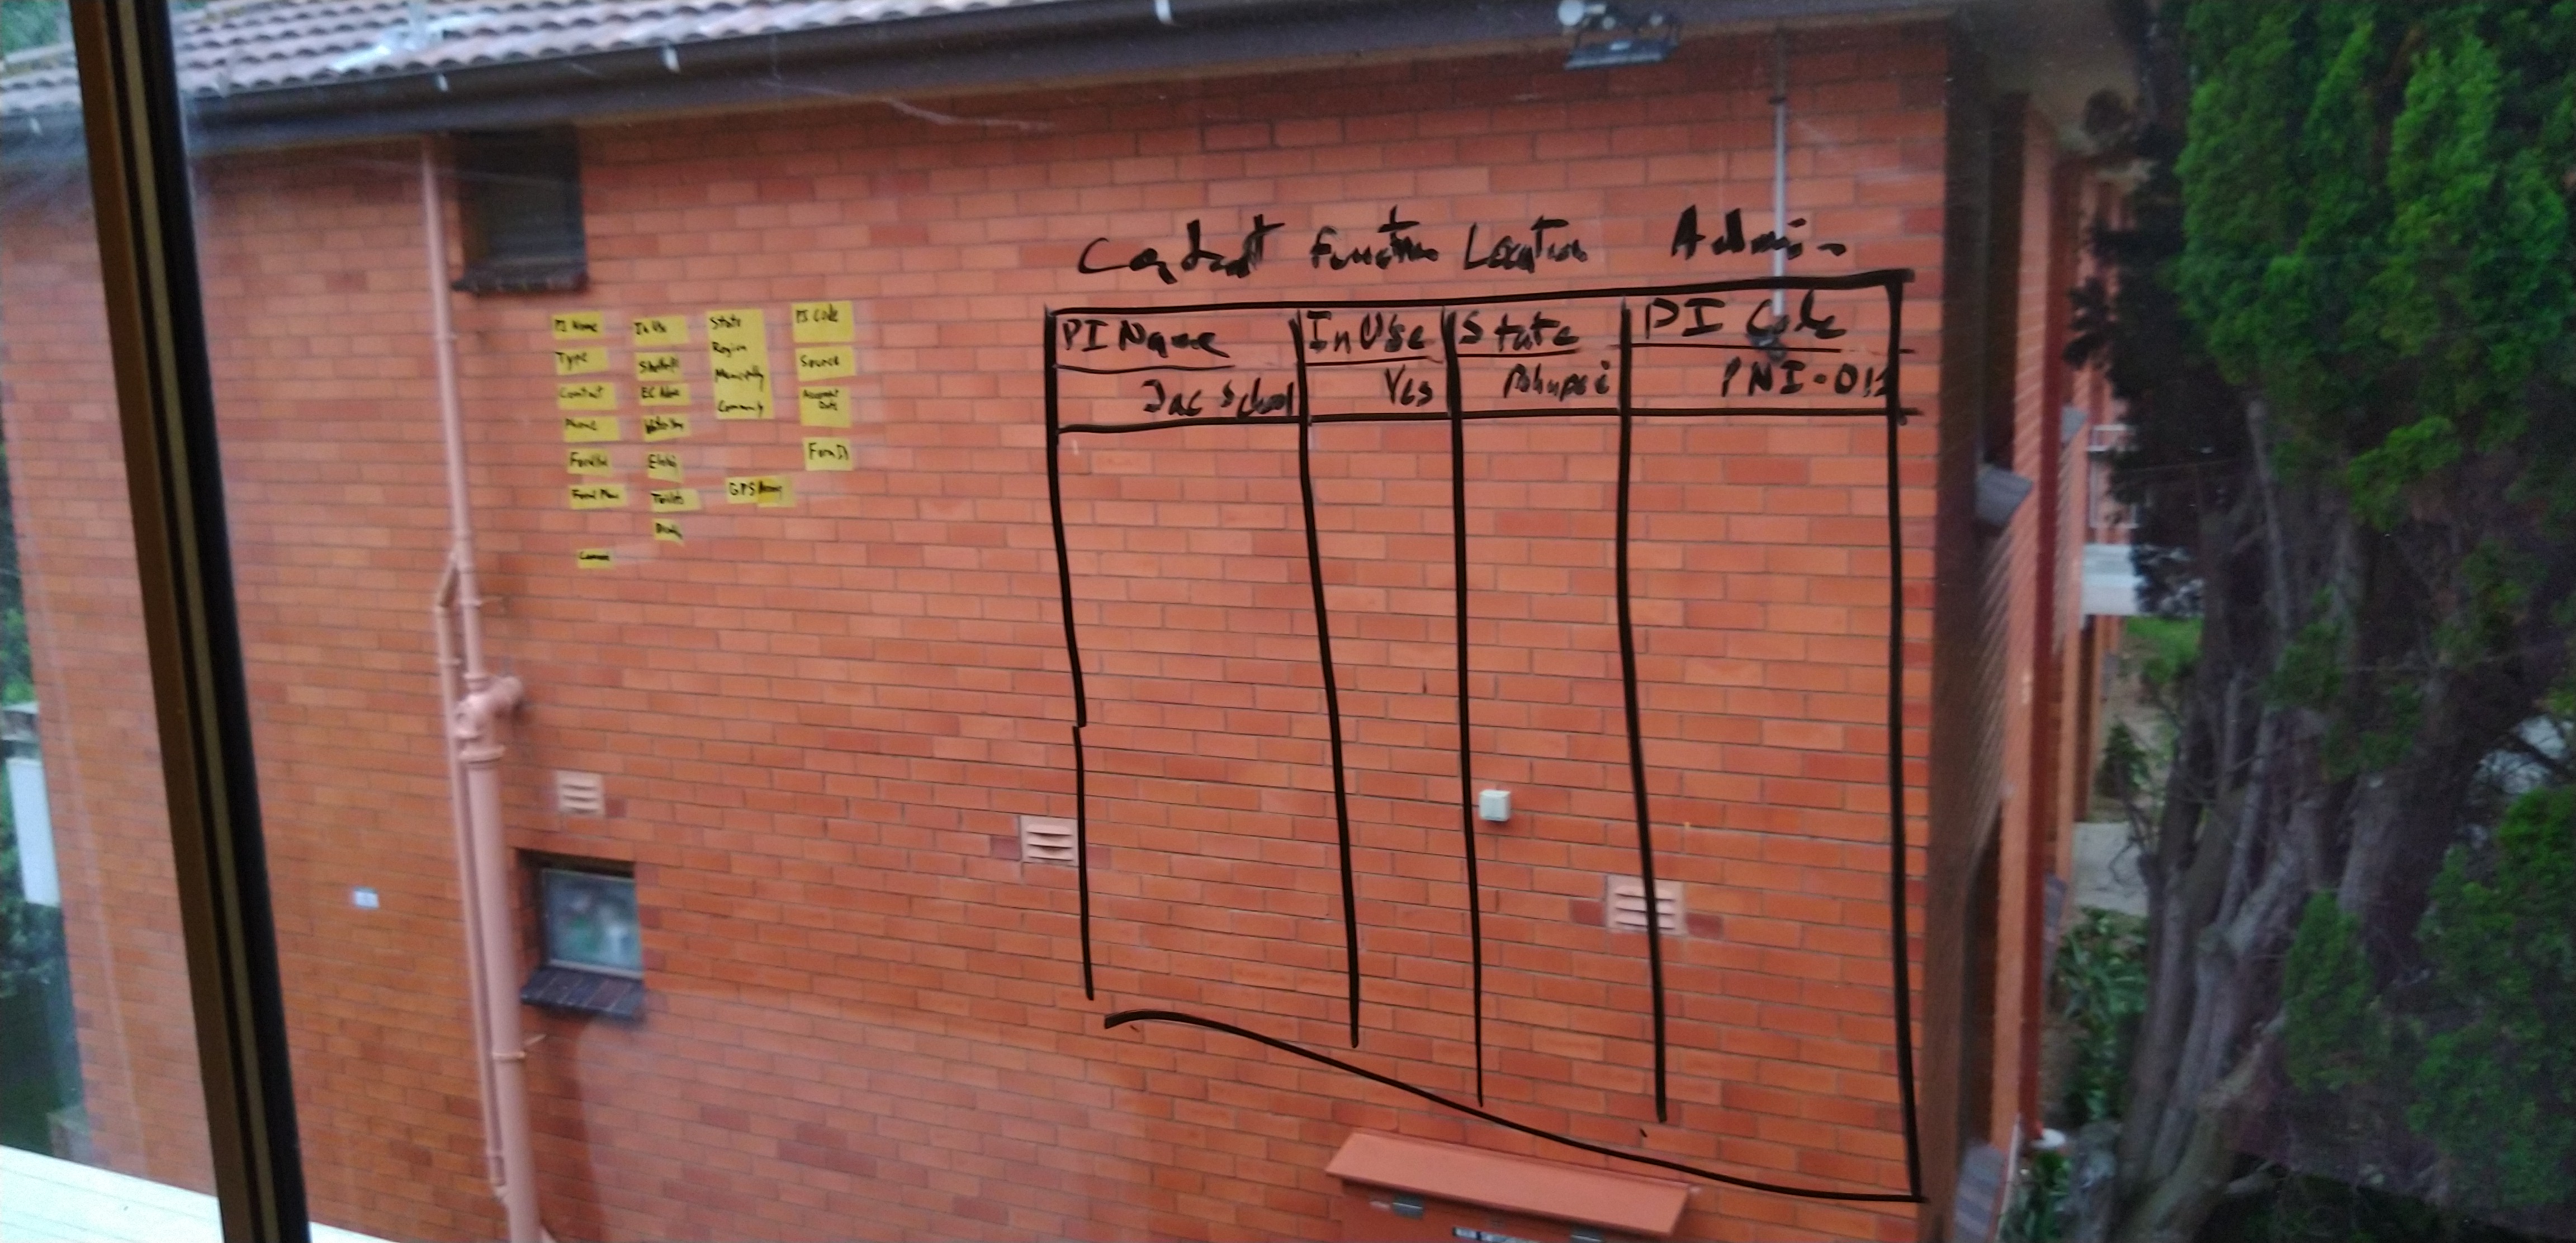
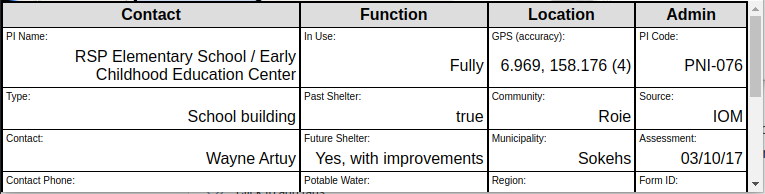
The end result includes only a subset of available attributes and focusses on those most important to the intended users. The four categories (Contact, Function, Location, and Admin) are helpful, but perhaps not completely consistent. For example, Type probably fits better under the Function heading, and Admin is not a very clear heading. Ultimately this was the best I could come up with and I think creates a positive user experience. I added a scroll feature to fit more content without detracting from the map view.
Aggregating Point Data
I chose to perform a spatial join of PI and municipalities prior to importing the data into my web map. I did this in QGIS and appended counts for each PI type to every polygon. I think this approach is correct, as no processor intensive spatial operations have to happen on the fly in the browser, and implementing this sort of operation in javascript would require an additional library or nontrivial code. That said, there are some caveats that come with using a spatial join operation for this aggregation. The municipality polygons are incomplete. There are several instances where land forms that are certainly part of a municipality are not included within a polygon.
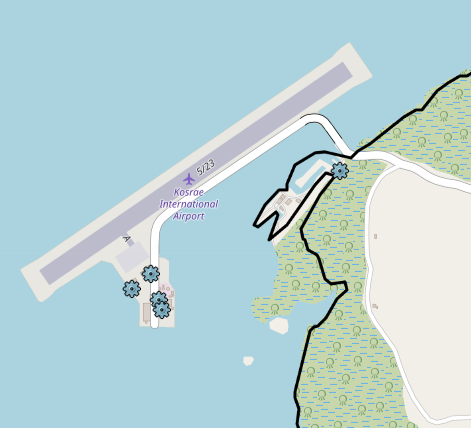
Additionally, some PI coordinates are inaccurate and fall well outside polygons.
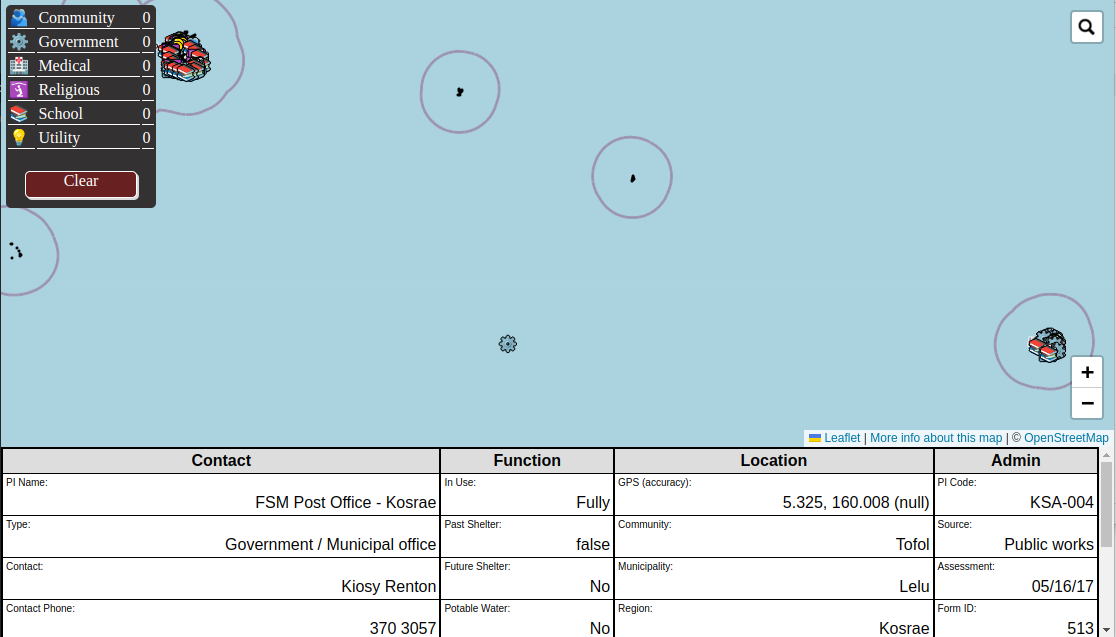
The consequence of these two caveats is that some PI are not included in any municipality polgyon and so are excluded from counts. I partially address this issue by providing default values for total counts of PI across the whole country when the app is initialized.

Alternatively I could have used the PI Municipality attribute to identify which PI belonged to which municipality and aggregate from there. Unfortunately there is some inconsistency in the FSM for place name spellings. I decided that the best option was for the aggregate value to represent the PI contained by the polygon as drawn. This allows the map to speak for itself; hopefully its obvious what points are excluded from counts and the root cause of that exclusion.